
"Plata v. Brown and Realignment: Jails, Prisons, Courts, and Politics," forthcoming, 48 Harv. Civ. Rghts-Civ. Lib. L. Rev. 165 (2013).
Technical Appendix
Last edited date: March 4, 2013
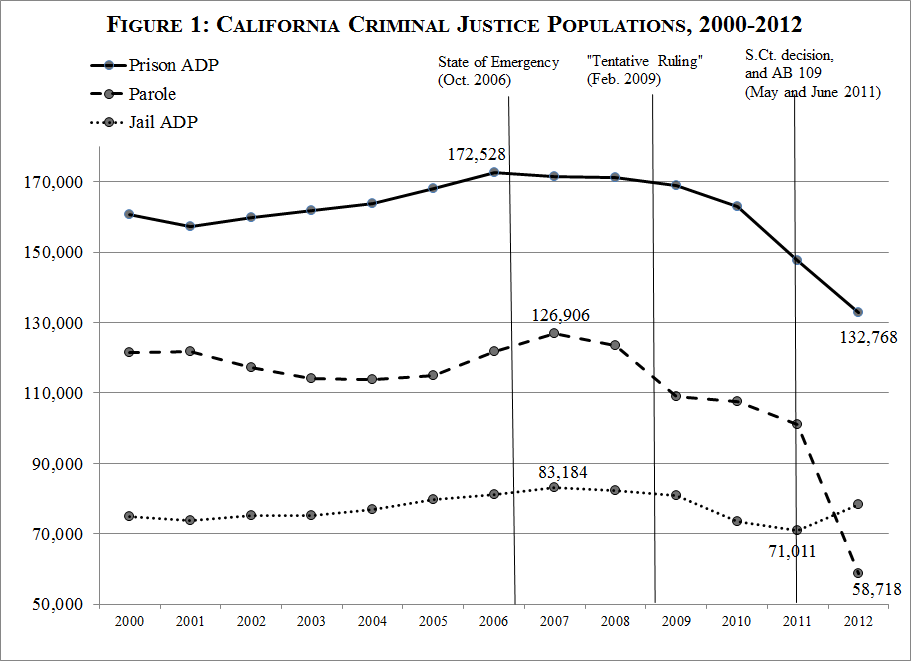
A. California Criminal Justice Populations, 2000-2012
See Article Figure 1 (here slightly updated)
(Click the graph below for full size image):
For data and sources, see Attached Worksheet
(“Figure 1” and “Figure 1&2 Data”)
B. California Criminal Justice Populations, October 2011 to October 2012.
The article (text accompanying fn. 176) references changes in jail and prison population with a starting point of Realignment’s effective date, October 2011. Here are the details:
Table App-1: Prison and Jail Average Daily Population
|
|
Oct. 2011 |
June 2012 |
Oct. 2012 |
|
Total Prisoners |
160,774 |
136,187 |
133,362 |
|
In-state Prisoners |
151,283 |
126,783 |
124,651 |
|
Prisoners in Cal. prisons* |
148,527 |
125,834 |
123,717 |
|
Jail |
72,285 |
78,263 |
[UNK] |
*Omits out-of-state, contract beds, hospitalizations
Sources:
Correction: The article states (text accompanying fn. 176): “From October 1, 2011 to October 1, 2012, California’s prison population was down over 23,000; over the same period of time, jail population was up, but only by 6,000.” October 2012 should have been June 2012. (The last jail population figures available, even several months after the article went to press, are for June 2012).
C. Quarterly California Jail Data
Described and referenced in text accompanying note 179. For data and sources, see Attached Worksheet (“Quarterly Jail Data”)
D. Prevalence of Jail and Prison Population Caps, Nationwide and in California
Article Table 1: Prevalence of Jail and Prison Population Caps, Nationwide and in California
|
|
Year |
(a)
Average daily prisoner population |
(b)
% of population housed in facilities w/ population cap |
(c)
Median age, if known, in years |
|
|
|
National |
California |
National |
California |
National |
California |
|
Local Jails |
1983 |
227,543 |
40,622 |
30% |
25% |
|
|
|
1988 |
336,017 |
63,359 |
43% |
77% |
|
|
|
1993 |
466,155 |
73,711 |
38% |
74% |
|
|
|
1999 |
607,980 |
77,851 |
25% |
71% |
6 |
7 |
|
2006 |
757,978* |
80,625* |
11% |
32% |
8 |
14 |
|
State Prisons |
1984 |
390,334 |
37,264 |
27% |
16% |
|
|
|
1990 |
635,974 |
86,966 |
24% |
7% |
|
|
|
1995 |
909,546 |
123,991 |
17% |
8% |
|
|
|
2000 |
1,170,172 |
159,223 |
13% |
9% |
9 |
2 |
|
2005 |
1,427,781 |
177,500 |
2% |
3% |
11 |
0 |
* Estimate
The tabulated data are compiled from the Bureau of Justice Statistics periodic jail and prison censuses.
1. Sources
I assembled the underlying dataset by aggregating survey the Bureau of Justice Statistics (BJS) Censuses of jails and prisons. Every five years or so beginning in 1970 for jails and 1979 for prisons, the BJS conducts a census of every jail and prison in the country. Raw data for the censuses are available from the Inter-university Consortium on Political and Social Research, http://www.icpsr.umich.edu/. BJS began collecting data on correctional court orders with the 1983 Jail Census, and the several relevant questions remained nearly unchanged in the subsequent jail and prison censuses.
The relevant census questionnaires prior to 2005 are collected here.
2005 Prison Census Questionnaires
2006 Prison Census questionnaires
Raw data citations are:
Prisons:
- Bureau of Justice Statistics, U.S. Dep’t of Justice, Census of State and Federal Adult Correctional Facilities, 2005 (ICPSR Study No. 24642, last updated Oct. 5, 2010), available at http://dx.doi.org/10.3886/ICPSR24642.v2
- Bureau of Justice Statistics, U.S. Dep’t of Justice, Census of State and Federal Adult Correctional Facilities, 2000 (ICPSR Study No. 4021, last updated July 9, 2004), available at http://dx.doi.org/10.3886/ICPSR04021.v1
- Bureau of Justice Statistics, U.S. Dep’t of Justice, Census of State and Federal Adult Correctional Facilities, 1995 (ICPSR Study No. 6953, Apr. 20, 1998), available at http://dx.doi.org/10.3886/ICPSR06953.v1
- Bureau of Justice Statistics, U.S. Dep’t of Justice, Census of State and Federal Adult Correctional Facilities, 1990 (ICPSR Study No. 9908, last updated Dec. 21, 2001), available at http://dx.doi.org/10.3886/ICPSR09908.v2
- Bureau of Justice Statistics, U.S. Dep’t of Justice, Census of State Adult Correctional Facilities, 1984 (ICPSR Study No. 8444, last updated Apr. 22, 1997), available at http://dx.doi.org/10.3886/ICPSR08444.v1
Jails:
- Bureau of Justice Statistics, U.S. Dep’t of Justice, National Jail Census, 2006 (ICPSR Study No. 26602, last updated Jan. 26, 2010), available at http://dx.doi.org/10.3886/ICPSR26602.v1
- Bureau of Justice Statistics, U.S. Dep’t of Justice, National Jail Census, 1999 (ICPSR Study No. 3318, last updated Aug. 16, 2002), available at http://dx.doi.org/10.3886/ICPSR03318.v3
- Bureau of Justice Statistics, U.S. Dep’t of Justice , National Jail Census, 1983 (ICPSR Study No. 8203, last updated Feb. 13, 1997), available at http://dx.doi.org/10.3886/ICPSR08203.v1
- Bureau of Justice Statistics, U.S. Dep’t of Justice, National Jail Census, 1988 (ICPSR Study No. 9256, last updated June 24, 1997), available at http://dx.doi.org/10.3886/ICPSR09256.v2
- Bureau of Justice Statistics, U.S. Dep’t of Justice, National Jail Census, 1993 (ICPSR Study No. 6648, July 13, 1996), available at http://dx.doi.org/10.3886/ICPSR06648.v1
The BJS itself publishes analyses of each census, including a basic descriptive table setting out court order data by facility by state. The relevant citations for the published reports about the censuses are:
- James Stephan, Bureau of Justice Statistics, U.S. Dep’t of Justice, NCJ 222182, Census of State and Federal Correctional Facilities, 2005 (2008), available at http://bjs.ojp.usdoj.gov/content/pub/pdf/csfcf05.pdf.
- James Stephan & Georgette Walsh, Bureau of Justice Statistics, U.S. Dep’t of Justice, NCJ 230188, Census of Jail Facilities, 2006 (2011), available at http://bjs.ojp.usdoj.gov/content/pub/pdf/cjf06.pdf.
- James J. Stephan & Jennifer C. Karberg, Bureau of Justice Statistics, U.S. Dep’t of Justice, NCJ 198272, Census of State and Federal Correctional Facilities, 2000 (2003), available at http://www.ojp.usdoj.gov/bjs/pub/pdf/csfcf00.pdf
- James J. Stephan, Bureau of Justice Statistics, U.S. Dep’t of Justice, NCJ 186633, Census of Jails, 1999 (2001), available at http://www.ojp.usdoj.gov/bjs/pub/pdf/cj99.pdf
- James J. Stephan, Bureau of Justice Statistics, U.S. Dep’t of Justice, NCJ 164266, Census of State and Federal Correctional Facilities, 1995 (1997), available at http://www.ojp.usdoj.gov/bjs/pub/pdf/csfcf95.pdf
- Craig A. Perkins, James J. Stephan & Allen J. Beck, Bureau of Justice Statistics, U.S. Dep’t of Justice, NCJ 151651, Census of Jails and Annual Survey of Jails: Jails and Jail Inmates, 1993–94 (1995), available at http://www.ojp.usdoj.gov/bjs/pub/pdf/jaji93.pdf
- James Stephan, Bureau of Justice Statistics, U.S. Dep’t of Justice, NCJ 137003, Census of State and Federal Correctional Facilities, 1990 (1992)
- Bureau of Justice Statistics, U.S. Dep’t of Justice, NCJ 127992, Census of Local Jails, 1988 (1991)
- Bureau of Justice Statistics, U.S. Dep’t of Justice, NCJ 105585, 1984 Census of State Adult Correctional Facilities (1987)Bureau of Justice Statistics, U.S. Dep’t of Justice, NCJ 95536, The 1983 Jail Census (1984).
2. Analysis/Code
The code underlying Article Table 1 is posted here.
The constructed dataset is here.
The resulting log file is posted here.
I mostly worked with the 2005 and 2006 data in excel, rather than stata. They are here.
E. California Jail Population Caps.
See “County Population Caps,” in Attached Worksheet
Correction: The article states: “From the 1990s to today, population cap orders from such cases have governed at least thirty-five counties, including all but two of California’s twenty largest counties.” Establishing a negative is difficult, but it is likely that four (not two) of California’s 20 largest counties have never seen a population cap: Contra Contra Costa, Ventura, San Mateo, and Monteray. Full data are in the “County Population Caps” page of the Attached Worksheet
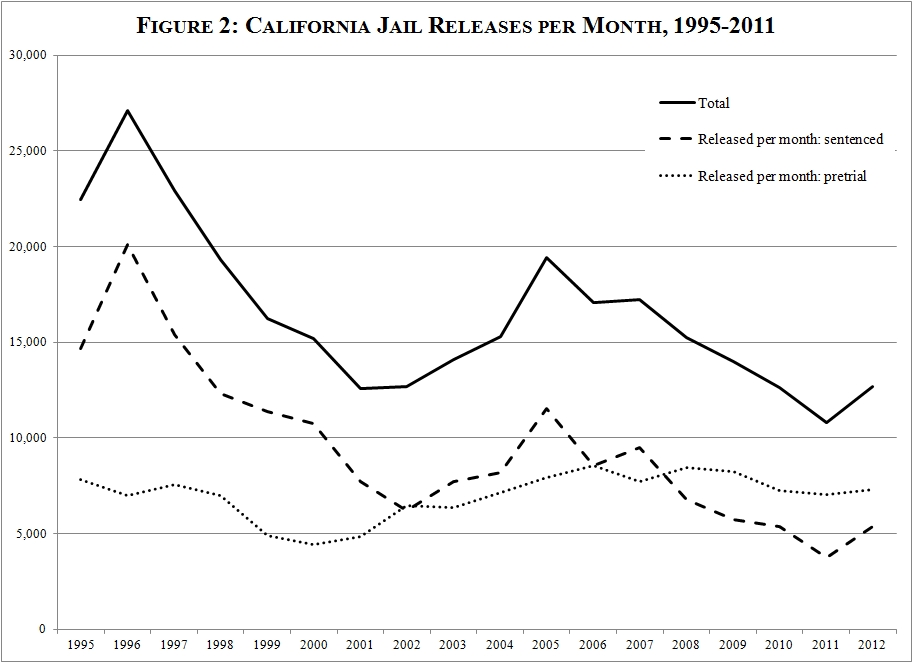
F. California Jail Releases.
Article Figure 2 and text accompanying note 236.
(Click the graph below for full size image):
See Attached Worksheet (“Figure 2,” “Figure 1 & 2 Data,” and “Jail Releases 2011-2012”)
G. Pretrial vs. Sentenced Prisoners in California’s Jails
See Attached Worksheet (“Quarterly Jail Data”)
H. Prisoner Releases from California Jails
Article Table 2, and text accompanying fn. 252; Article Table 3.
Table 2: Monthly Prisoner Releases from California Jails
|
Year |
(a)
Booked/ month |
Prisoner releases per month |
|
(b)
Total |
(c)
Pretrial prisoners |
(d)
No court-ordered cap (% of pretrial) |
(e)
Sentenced prisoners |
(f)
No court-ordered cap (% of sentenced) |
|
2008 |
107,042 |
15,294 |
8,332 |
4% |
6,962 |
12% |
|
2009 |
101,153 |
14,465 |
8,199 |
4% |
6,266 |
15% |
|
2010 |
96,391 |
11,950 |
6,987 |
5% |
4,963 |
7% |
|
2011 |
88,551 |
10,196 |
6,649 |
7% |
3,547 |
14% |
See Attached Worksheet (“County Population Caps”). Note: Following the practice of the data source, total bookings include not only county jails but three additional populations assigned to: the San Diego Work Furlough, Ventura Work Furlough, and the Santa Ana Police Department. I do not know the reasons that these small populations are included but others that seem to be like them are not. The impact on the recorded figures is, however, immaterial.
Correction: The article states “While thirty-eight of California’s fifty-eight counties report that limited capacity has forced them to release prisoners at some point in the past several years, only a small majority of these have a court order to point to.” The correct figure is forty-one (not thirty-eight) of the fifty-eight counties.
Table 3: Population Releases in 2012 (Partial Data: Some Jails only)
|
|
(a)
Est. % of Jail Population Reporting |
(b)
Population related releases/month
|
(c)
% increase, compared to
the same jails in 2011
|
|
Total |
Pretrial |
Early |
Total |
Pretrial |
Early |
|
Jan. |
72% |
9,248 |
5,798 |
3,450 |
21% |
5.2% |
38.4% |
|
Feb. |
66% |
5,645 |
2,759 |
2,886 |
38% |
10.6% |
43.4% |
|
Mar. |
60% |
5,868 |
2,745 |
3,123 |
44% |
17.8% |
42.2% |
|
Apr. |
34% |
3,264 |
2,063 |
1,201 |
25% |
1.0% |
53.0% |
This table became out of date well before the article went to press, but unfortunately it was not able to be updated in print. The updated information follows:
Table App-2: California Jail Population Releases in 2012
|
|
(a)
Est. % of Jail Pop. Reporting |
(b)
Population related releases/month |
(c)
% increase, compared to
the same jails in 2011 |
|
Total |
Pretrial |
Early |
Total |
Pretrial |
Early |
|
Jan. |
100% |
11,960 |
7,239 |
4,721 |
12% |
4% |
28% |
|
Feb. |
100% |
11,428 |
6,813 |
4,615 |
23% |
9% |
53% |
|
Mar. |
100% |
12,190 |
7,279 |
4,911 |
20% |
10% |
38% |
|
Apr. |
100% |
12,431 |
7,006 |
5,425 |
22% |
4% |
57% |
|
May |
100% |
14,203 |
7,756 |
6,447 |
42% |
17% |
90% |
|
June |
100% |
13,942 |
7,856 |
6,086 |
45% |
31% |
70% |
|
July |
73% |
8,844 |
4,660 |
4,184 |
40% |
20% |
72% |
|
Aug. |
67% |
9,329 |
4,894 |
4,435 |
38% |
16% |
77% |
|
Sept. |
65% |
7,348 |
3,411 |
3,937 |
56% |
34% |
82% |
|
Oct. |
16% |
2,405 |
1,485 |
920 |
53% |
29% |
121% |