|
Margo Schlanger, Technical Appendix to
Civil Rights Injunctions Over Time:
A Case Study of Jail and Prison Court Orders
(May 5, 2006)
|
|---|
Article summary | Article PDF via SSRN | Article PDF
Organization. In this Technical Appendix, I provide data, code, and additional analysis relating to my published article, Civil Rights Injunctions Over Time (referred to below as, simple, the "article").
This Technical Appendix does not contain the unpublished documents cited in the article. For those, see the Civil Rights Litigation Clearinghouse.
A. Dataset used to run the article's analysis.
All relevant censuses, relevant variables only, jail and prison, panelized: in stata format [here]. (Details on assembling the database are below)
B. Do-files used to run the article's analysis, as well as the additional analysis described below, and resulting log file and graphs. (do-files and log posted as .txt files; just download and eliminate the extra suffix)
Main do-file in stata format [here]
You'll also need this subsidiary do-file in stata format [here]
Log-file in text format [here]
Graphs:
size_and_population_totals.gph
orders.gph
All_orders.gph
fac_orders.gph
orders_xNYOH.gph
state_adp_histograms_red.gph
state_adp_histograms_b&w.gph
intrastate_changes_histograms.gph
intrastate_changes_histograms_percent.gph
totality.gph
topic_histograms.gph
topic_histograms_adp.gph
topic_histograms_2.gph
adp_and_orders.gph (size effect)
figure3.gph (size effect).
Article figure 4 (Jail and Prison Court Order Incidence, showing old and new regulation):
Underlying excel file
Additional detail: Old and new order topics (excel file)
C. Several footnotes in the published piece reference this appendix; they are linked to the relevant passage in the main discussion below:
n. 68: Prevalance of medical care orders, and other topics, in Bureau of Justice Statistics correctional census reports.
n. 82: Missing observations in Bureau of Justice Statistics correctional censuses.
n. 86: More on Bureau of Justice Statistics correctional censuses.
n. 89 & n. 102: Multiple jails in single jurisdictions.
n. 104: Statistical analysis of changes over time, within states, of court-order incidence in jails and prisons.
n. 106: Statistical analysis of distribution by state of court-order incidence in jails and prisons.
n. 114: Logistic regressions assessing relationship between facility size and court-order incidence.
n. 149: Fuller data from Kenneth L. Manning & Robert A. Carp, Declarations of Independence? Federal District Court Judges and the Congruence of their Decision-Making with Public Opinion 15 tbl.2 (unpublished manuscript, prepared for 2003 Sw. Pol. Sci. Ass’n).
n. 165: Federal Court of Appealscases that cite Lewis v. Casey as raising a general issue about standing or the permissible scope of injunctive relief.
D. I organize the remainder of this Appendix as follows :
Citations to the underlying article appear as, e.g., "see Article n. 81".
- The Bureau of Justice Statistics’ Jail and Prison Censuses
- Sources: questionnaires and raw data
- Assembling the dataset
- Jail and prison population: my figures and their comparison with BJS publications.
- Observational units
- Reliability
- Missing data
- Missing data: size of jurisdiction
- Missing data: region of jurisdiction
- Missing data: prior court order status
- Court orders within states: more complete results
- Changes within states over time
- Distribution within states
- The size effect and its changes over time
- Court order topics
- Ideological trends in reported U.S. District Court decisions
- Cases citing Lewis v. Casey for propositions relating to limiting injunctive relief
1. The Bureau of Justice Statistics’ Jail and Prison Censuses
a. Sources
The article’s quantitative data and analysis are from a dataset I have assembled from the Bureau of Justice Statistics’ Censuses of jails and prisons. Every five years or so beginning in 1970 for jails and 1979 for prisons, the Bureau of Justice Statistics (“BJS”) conducts a census of every jail and prison in the country. The raw data for the censuses are available from the Inter-university Consortium on Political and Social Research, http://www.icpsr.umich.edu/. BJS began collecting data on correctional court orders with the 1983 Jail Census, and the several relevant questions remained nearly unchanged in the subsequent jail and prison censuses.
The relevant census questionnaires are available here:
Raw data citations are:
Prisons:
1984: Bureau of Justice Statistics, U.S. Dep’t of Justice, Census of State Adult Correctional Facilities, 1984 (ICPSR Study No. 8444, last updated Apr. 22, 1997)
1990: Bureau of Justice Statistics, U.S. Dep’t of Justice, Census of State and Federal Adult Correctional Facilities, 1990 (ICPSR Study No. 9908, last updated Dec. 21, 2001)
1995: Bureau of Justice Statistics, U.S. Dep’t of Justice, Census of State and Federal Adult Correctional Facilities, 1995 (ICPSR Study No. 6953, Apr. 20, 1998)
2000: Bureau of Justice Statistics, U.S. Dep’t of Justice, Census of State and Federal Adult Correctional Facilities, 2000 (ICPSR Study No. 4021, last updated July 9, 2004). I actually used pre-publication data provided by the Bureau of Justice Statistics because there were errors in the posted data.
Jails:
1983: Bureau of Justice Statistics, U.S. Dep’t of Justice , National Jail Census, 1983 (ICPSR Study No. 8203 , last updated Feb. 13 , 1997 )
1988: Bureau of Justice Statistics, U.S. Dep’t of Justice, National Jail Census, 1988 (ICPSR Study No. 9256, last updated June 24, 1997)
1993: Bureau of Justice Statistics, U.S. Dep’t of Justice, National Jail Census, 1993 (ICPSR Study No. 6648, July 13, 1996)
1999: Bureau of Justice Statistics, U.S. Dep’t of Justice, National Jail Census, 1999 (ICPSR Study No. 3318, last updated Aug. 16, 2002).
The BJS itself publishes analyses of each census, including a basic descriptive table setting out court order data by facility by state. For full citations to these publised reports, see Article n. 81.
b. Assembling the dataset
The BJS neither analyzes its data longitudinally at either the facility or system level, nor releases the data in a form readily amenable to such analysis. This has ruled out many avenues of inquiry. For example, unless you line up facilities and/or jurisdictions from the different censuses, you cannot look for differences between old and new orders, or analyze any distinctions between order retention and order acquisition. With some travail, however, I was able to put the prison censuses into one database organized by individual facility and the jail censuses into two similar databases organized (through 1993) by facility and (through 1999) by jurisdiction.
The beginning component datasets, in .txt format, are:
Raw data, Jail: 1983, 1988, 1993, 1999
Raw data, Prison: 1984, 1990, 1995, 2000 (2000 is in SPSS .sav format)
The syntax files to open and begin to process the data, in .sps format, are:
Jail: 1983, 1988, 1993, 1999
Prison: 1984, 1990, 1995, 2000
Syntax files to merging data into two large databases, in .sps format
Merging jails, facility level
Merging jails, jurisdictional level
Merging prisons
Do-files to panelize data, in stata format (all are posted as .txt files; just download and eliminate the extra suffix)
Panelizing prisons
Panelizing jails -- facility level
Panelizing jails -- jurisdictional level
Alternatively, syntax files to panelize data, in .sps format
Panelizing prisons part 1
Panelizing prisons part 2
Panelizing jails part 1
Panelizing jails part 2
c. Jail and prison population: my figures and their comparison with BJS publications.
Table App.-1: Total Population and Facility Counts,
Jails and Prisons, 1983-2000
| Facility type |
year |
N (facilities) |
sum (inmates) |
mean
(inmates) |
std. dev. (inmates) |
Jails |
1983 |
3,043 |
227,541 |
75 |
366 |
1988 |
2,984 |
336,017 |
113 |
594 |
1993 |
2,974 |
466,155 |
157 |
725 |
1999 |
3,017 |
607,978 |
202 |
733 |
Prisons |
1984 |
903 |
390,334 |
432 |
637 |
1990 |
1,207 |
635,974 |
527 |
756 |
1995 |
1,375 |
909,546 |
661 |
838 |
2000 |
1,562 |
1,170,171 |
749 |
920 |
Source: Raw data, BJS correctional censuses. see Article n. 81. |
The figures in Table App.-1 describe the universe underlying all the analysis in the article. I checked them against the BJS’s published figures using two points of comparison: the number of facilities (or jurisdictions for jails in 1999), and the total population. My figures match the official published ones except at three, immaterial, points. First, the BJS puts the number of state prison facilities in 2000 at 1558, and second, the BJS puts the total number of inmates confined in 2000 at 1,178,807. See Allen J. Beck & Laura M. Maruschak, Mental Health Treatment in State Prisons, 2000 (Bureau of Justice Statistics Special Report, NCJ 188215) (July 2001) at 5 (Appendix Tbl. A), 6 (Appendix Tbl. B), available at https://www.ncjrs.gov/app/publications/abstract.aspx?ID=188215. I report 1562 prisons and 1,170,171 inmates. The differences, which are too small to matter to the analysis, seem to stem from coding decisions relating to whether several private and community corrections facilities in California and Texas are properly considered federal or state facilities. Finally, the BJS published the total 1993 jail population as 466,224, see Tracy L. Snell, Correctional Populations in the United States, 1993 (U.S. Department of Justice, Bureau of Justice Statistics, NCJ 156241) (Oct. 1995) (tbl 4.1) available at https://www.ncjrs.gov/app/publications/abstract.aspx?ID=156241 – but this was simply an arithmetic error on its part; my figures agree with BJS’s state-by-state breakdown.
d. Observational units: jails and prisons, facilities and jurisdictions
Article, p. 574-575:
One important limitation is that the most recent censuses use individual facilities as the observational unit for prisons, but jurisdictions as the observational unit for jails. In order to use the relevant data, I have, regrettably, been forced to follow suit. Prisons are usually state facilities that house exclusively felony convicts, whereas jails are the county- and city-run institutions that house a combination of pretrial detainees, post-trial convicts not yet admitted to prison, misdemeanants, and fairly short-term felony offenders. Because most jails are operated by single counties or cities and most counties and cities operate just one jail, for 95% of the nation’s nearly 3100 jail jurisdictions, the distinction between jurisdiction and facility makes no difference; where that distinction does become relevant to the analysis below, I discuss it.[fn 89: The 95% figure is derived from census data. See Technical Appendix, supra note 68, for a more thorough discussion of this issue.] |
Prisons. As stated above, leaving the federal Bureau of Prisons to one side, prisons are mostly operated by states. This project omits the federal Bureau of Prisons because not all of the censuses included information from federal prisons. (Federal jails are also omitted.) There are a few private prisons; I have classified them as state prisons if they reported that they housed state prisoners, and as federal prisons if they reported federal prisoners. In some states (for example, Massachusetts and Tennessee), counties run some shorter-term prisons; the BJS includes these in its jail censuses and I have followed suit. Correspondingly, in states in which it is the state that runs the jail system, the BJS classifies the relevant facilities as prisons, because they are operated by the prison system’s personnel and often house what would in other states be both jail and prison inmates. There would be no way to undo this choice and I have not made the attempt. Six states are affected: Alaska (which also has six facilities classified as jails), Connecticut, Delaware, Hawaii, Rhode Island, and Vermont.
Jails. Most jails are operated by single counties or cities – and most counties and cities operate just one jail. So, as the article states, for 95% of the nation’s nearly 3100 jail jurisdictions, the distinction between jurisdiction and facility makes no difference. However, the largest jails, which house the majority of all jail inmates, are nearly all in jurisdictions that operate more than one jail. New York City and Los Angeles County are examples of large jurisdictions with multiple jails. The small multi-facility portion of jail jurisdictions includes extremely disproportionate population – more than 38% of the nation’s total jail population, in 1999. And even less populous jurisdictions frequently operate more than one jail; perhaps one for each side of a geographically large county, or for different types of incarceration (pre and post-trial). My analysis would therefore ideally use individual jail facilities as the observational unit, as I have done with prisons.
Unfortunately, however, this is not possible. The first reason is substantive. One of the advantages of facility-level observation is that it allows longitudinal analysis. One can observe, for example, whether a given jail under court order in 1988 remained subject to court order in 1993. But longitudinal analysis of individual facilities requires a number of difficult-to-make judgment calls about how to treat changes in individual jurisdictions between different census administration years. If a jurisdiction closes down one jail and opens another in its place, it probably makes sense to treat the two facilities as one and the same. If the old one reports a court order in 1983, and the new one reports a court order in 1988, it makes the most sense to think of the order as continuing rather than new. This already presents a set of coding problems (since the two facilities typically have different id codes). But far more difficult is the decision what to do if a jurisdiction closes down two jails, opening up one new facility in its place, or if a jurisdiction opens a new jail, and then gradually moves inmates into it from another facility or facilities (so that for a given census administration, both old and new facilities are reported). In sum, facility-level analysis is likely to suffer from a good deal of noise generated by such judgment calls – noise that is eliminated by collapsing to a jurisdictional level the observations in the 10% of jail jurisdictions with multiple facilities.
Moreover, the available data simply cannot support this inquiry. The article uses four administrations of the BJS National Jail Census – 1983, 1988, 1993, and 1999. These varied in their approach to data collection. The 1983 and 1988 censuses present facility-level information. In 1993, however, the jail census allowed participants to choose whether to report information facility by facility or summed up for an entire jurisdiction. Most of the 200 jurisdictions that reported more than one jail facility chose facility-level reporting, but 18 instead chose jurisdiction-level reporting. For those 18 jurisdictions, then, no facility-level information about court orders is available. In 1999, the ratios shifted; the BJS encouraged census participants to report at a jurisdictional level, and only 61 jurisdictions with more than one facility chose instead to report any facility-level data; the other 139 reported at the jurisdictional level.
In short, the available data can be used to understand changes over time in court orders only if the jail data is collapsed to the jurisdiction level. I have done so, using the following protocols for the presence of court orders:
i) Where the reporting facilities are consistent regarding the status of court orders (yes, no, or missing data), I followed that consistent report for the jurisdiction-level value.
ii) I report the court-order information as missing only where it is missing in each reporting facility in a jurisdiction. Where some facilities report and others do not, I ignore the “missings.”
iii) Where any facility in a jurisdiction reports a court order as present, I report the jurisdiction level value as “yes.”
iv) Thus, the jurisdiction-level value is “no” only where all the individual facilities report “no,” or one or more report “no” and the others report nothing.
Even though changing the unit of analysis affects only 5% of the jail jurisdictions, the covariance between size and court order incidence means that the collapse of the data does change the results reported in this paper. Because jails in multi-facility jurisdictions are more likely to report court orders, the order-incidence tables and figures slightly understate the incidence of court orders by individual jail. More significant is that because of choice iii, above (an order in any facility in a given jurisdiction collapses to an order for the entire jurisdiction), my tables and figures overstate the incidence of court orders by jail population by something like 6-8% of national jail population in 1983, 1988, and 1999, and presumably by a similar amount in 1999, though insufficient facility level data for multiple-facility jurisdictions are available to do the requisite analysis. I am able to quantify the over-statement in the years prior to 1999, when facility level data is available for jails. In each of the three prior census years, the jail population in facilities with court orders is 6 to 8 percentage points less than the jail population in jurisdictions with court orders. (See the replication code, above)
e. Reliability of BJS correctional censuses.
The article rests in part on the reliability of the self-reported BJS census data, so I should note that I have found them quite reliable in general. There may be, however, a tendency for prisons to understate the incidence of court orders, especially when the status of such court orders is unclear. For example, Oklahoma’s prisons were subject to a court order in the case Battle v. Anderson from the 1970s until the late 1990s. See Battle v. Anderson, 376 F. Supp. 402 (E.D. Okla. 1974); Battle v. Anderson, 447 F.Supp. 516 (E.D. Okla. 1977), aff’d, 564 F.2d 388 (10th Cir. 1977); Battle v. Fields, 81 F.3d 172 (10th Cir. 1996), vacated and remanded, Fields v. Battle, 519 U.S. 801 (1996), reinstated, Battle v. Fields, 100 F.3d 967 (10th Cir. 1996). But that’s not what those prisons reported. This discrepancy seems founded not in sloppiness but in a substantive judgment about the operation of the relevant court order; the state argued in court that (consistent with the BJS data) court supervision terminated in 1983. Although the state lost that argument, the definitive ruling, Battle v. Fields, 81 F.3d 172 (1996), was not made until after the 1995 BJS census. Similarly, New York's prisons did not report the consent decree entered in 1983 in Hurley v. Coughlin, 158 F.R.D. 22 (S.D.N.Y. 1993), a case concerning routine strip searches. But a 1993 opinion in that case evidences the state's (mistaken) belief that it was not actually bound by the consent decree; apparently not until a January 1994 stipulation did the state acknowledge its ongoing obligation. Hurley v. Coombe, 1996 WL 46889 (S.D.N.Y. Feb. 6, 1996). Even so, only four New York prisons reported search-related orders in 1995. By 2000, however, they all did. Presumably it took quite a bit of time for the prison officials to promulgate the newly clarified decree. The point is that these discrepancies between the self-reported census data and the world as it appears through judicial opinions indicate that the relevant orders, while they may be legally binding, are not practically salient.
In jails, however, I have seen more evidence of true error: I have twice gotten in touch with personnel at very small facilities that reported orders to the BJS only to find that nobody there knows of any such order, past or present. At larger facilities, I have not run into such issues. I do not think the amount of error poses much of a problem for the analysis, because it seems to be limited to very small facilities.
f. Missing data.
The prison data are complete; at least as far as the BJS could determine, every non-federal prison in the nation completed the census in each of the years relevant to this project. Moreover, every observation is complete in pertinent part; the BJS did not report any missing information. The same state of affairs holds for the jail data in 1983 and 1988 – but not in 1993 and 1999. In each of those latter years, about 10% of jail jurisdictions failed to complete the census. More precisely, in 1999, nonresponders totaled 241 jail jurisdictions holding 32,369 inmates, and in 1993, 303 jail jurisdictions holding 26,587 inmates.
The BJS was nonetheless successful in identifying each non-responder by state and county or city, and its incarcerated population. It is therefore possible to compare the responders with the non-responders. That comparison demonstrates no large differences among the groups. They show essentially the same distribution of size and more or less the same regional distribution. The 1993 non-responders were only proportionally likely to be non-responders in 1999 as well. Moreover, there is little sign of any difference in court order activity among the responders and the non-responders; the 1993 non-responders were not demonstrable different from the responders in their court order incidence in 1988. In this section, I present fuller analysis of missing data, looking at whether non-reporting jurisdictions are importantly different from reporting jursidictions, in order size or in region, or in their report of court orders in the preceeding census administration.
i. Missing data: size of jurisdiction
Table App.-2 compares the size ("adp" means average daily population) of reporting and non-reporting jail jurisdictions. It shows that the non-reporters tend to be a bit smaller.
Table App.-2: Inmate population in reporting and
non-reporting jail jurisdictions
| Year |
Status |
n |
Mean ln(adp) |
Mean adp |
1993 |
Reporting |
2761 |
3.57 |
165 |
Nonreporting |
303 |
3.29 |
88 |
Total |
2974 |
3.54 |
157 |
1999 |
Reporting |
2776 |
3.90 |
207 |
Nonreporting |
241 |
3.55 |
134 |
Total |
3017 |
3.87 |
202 |
| Source: 1993 and 1999 Bureau of Justice Statistics Jail Censuses. |
As might be expected given such large samples, the differences among the log-transformed populations are statistically significant (the p-values for t-tests are < .01). The non-transformed populations are highly skewed and also extremely dispersed (which is why the log transformation is useful), but for whatever it’s worth, the differences are not statistically significant (in 1993, the t-test p-value is .08; in 1999 it is .14).
Even though the population difference between the reporting and nonreporting groups is statistically significant, it is small enough to be inconsequential for my analysis. In terms of court-order incidence, a shift in size from 134 to 207 (as in 1999) accompanies a shift in court-order incidence of just a few percentage points, among the jails about which we have data. (See the discussion of size effect, below.)
ii. Missing data: Region of jurisdiction
Another point of comparison between the reporting and the nonreporting groups is their regional distribution. Table App.-3 presents the data.
Table App.-3: Regional distribution of reporting
and non-reporting jail jurisdictions
|
1993 |
1999 |
Region |
Reporting
(n = 2671) |
Nonreporting
(n = 303) |
Reporting
(n = 2776) |
Nonreporting
(n = 241) |
New England |
1%* |
0%* |
1% |
0% |
Mid-Atlantic |
6%* |
2%* |
6% |
3% |
South |
40% |
40% |
41% |
39% |
South/non-confed |
7%* |
10%* |
7%* |
11%* |
Midwest |
24% |
29% |
24% |
26% |
Plains |
7% |
8% |
7% |
6% |
Pacific/SW |
8%* |
2%* |
8% |
9% |
West |
6% |
8% |
6% |
6% |
Source: 1993 and 1999 Bureau of Justice Statistics Jail Censes.
* Difference is statistically significant ( |adjusted residual|>2 in chi-square test) |
The table demonstrates that regional differences between the reporters and the non-reporters are statistically significant in each of the starred cells. But the difference is, substantively, not very large and does not cause me serious concern.
iii. Missing data: Prior court order status
Table App.-4: Prior court order status in reporting and
non-reporting jail jurisdictions
| Year |
Status |
n |
Portion with prior reported court order |
|---|
| 1993 |
Reporting |
2559 |
0.148 |
|---|
Nonreporting |
286 |
0.105 |
Total |
2845 |
0.143 |
| 1999 |
Reporting |
2353 |
0.155 |
|---|
Nonreporting |
181 |
0.166 |
Total |
2534 |
0.156 |
| Source: 1993 & 1999 Bureau of Justice Statistics Jail Censuses. |
|---|
Table App.-3 demonstrates that to the extent there is any statistically significant difference in prior reported court-order status between those jurisdictions that reported in 1993 or 1999, and those that didn't, it is that the non-reporting jurisdictions in 1993 were slightly less likely to have had a court order in the prior census administration, in 1988 (p = .05). The difference in 1999 is not statistically significant (p = .70). Since facilities with prior orders are far more likely to still have orders in succeeding periods, this means that the results reported in the article may understate slightly the degree of court order regulation that actually existed in 1993 -- a result that strengthens rather than weakens the article's conclusions.
2. Court orders within states: More complete results
a. Changes within states
Table App.-4 augments the article’s Figure 1, which is replicated below. The figure and table describe changes in the percentage of incarcerated population within each state subject to court order. As the article states (p. 579), the first two rows of graphs "provide still further confirmation of stability in the 1980s and early 1990s: Nearly all the states experienced some change in proportion of population covered by court orders from the mid-1980s to the mid-1990s, but most states experienced quite small change, and the states experiencing decreases in coverage were balanced by a similar number of states experiencing increases. Moreover, there is no statistically significant difference between the 1983–1988 data and the 1988–1993 data for jails, and likewise for the corresponding data for prisons."
Footnote 104 of the article stated:
"In a paired t-test, the distributions of facility order incidence by state are not demonstrably different across any years (the p-values on the test are all greater than .25, and usually much greater). The population-weighted order incidence by state presents a statistically significant difference only between the penultimate and the final period (p-value for jails = .03, p-value for prisons < .001). Full results are presented in this Article’s Technical Appendix, supra note 68.] As hypothesized, however, the situation changes notably between the last pre-PLRA data point and the single available post-PLRA data point. As one would expect from Tables 1 and 2, Figure 1’s third row of graphs shows that in both jails and prisons, the within-state changes become negative and much larger after the mid-1990s. That is, many more states experienced contraction in court-order coverage in both jail and prison populations than experienced expansion. This is true for both small and large increases, and testing confirms that these differences are statistically significant."
Unfortunately, this footnote should have accompanied not figure 1 but figure 2 (see Table App.-5, below). But the basic idea -- that only in the last period did substantial shrinking of court order incidence take place -- holds.
Article Figure 1 (reprinted): Change by State in Proportion of
Incarcerated Population Housed in
Entities Subject to Court Order
Table App.-5 shows both mean and variance. The last two columns show the p-values for the (two-tailed) F-test that looks for changes in variance, and the T-test that looks for changes in mean. I examined both the facility level and the population weighted data.
Table App.-5: Accompanies Article Figure 1
Statistical testing of changes by state in court-order coverage
|
Mean change over period stated, within states |
Std. dev. of changes |
95% conf. interval of changes |
F-test: Variance different from prior line?
P-value |
T-test:
Mean different from prior line?
P-value |
Jails by facility |
|
|
|
|
|
1983-1988 |
-.0066688 |
.0981242 |
-.0358081 .0224705 |
|
|
1988-1993 |
.0117658 |
.0706278 |
-.0092081 .0327396 |
0.0297* |
0.3041 |
1993-1999 |
-.0123746 |
.0984888 |
-.0416222 .0168729 |
0.0279* |
0.1804 |
Jails by population |
|
|
|
|
|
1983-1988 |
.0018369 |
.1693806 |
-.0484629 .0521368 |
|
|
1988-1993 |
-.0016165 |
.1628036 |
-.0499632 .0467302 |
0.7917 |
0.9208 |
1993-1999 |
-.0917991 |
.1656524 |
-.1409918 -.0426064 |
0.9079 |
0.0099* |
Prisons by facility |
|
|
|
|
|
1984-1990 |
.0267231 |
.2357365 |
-.0395789 .0930251 |
|
|
1990-1995 |
-.0002281 |
.1977021 |
-.0558327 .0553765 |
0.2169 |
0.5331 |
1995-2000 |
-.0638712 |
.3706486 |
-.1681178 .0403754 |
0.0000* |
0.2827 |
Prisons by population |
|
|
|
|
|
1984-1990 |
.0241891 |
.3050936 |
-.0616199 .1099981 |
|
|
1990-1995 |
.0087321 |
.2343487 |
-.0571795 .0746437 |
0.0650 |
0.0650 |
1995-2000 |
-.13241 |
.4393969 |
-.2559924 -.0088277 |
0.0000* |
0.0000* |
* Difference is statistically significant.
b. Distribution within states
The article's Figure 2 elaborates this last point, showing in more detail the difference between the mid-1990s and the 1999/2000 datapoints for jails and prisons. The graphs are histograms; they graph the total distribution of changes in court order coverage , by state. Figure App.-B includes all eight histograms rather than just the four that appear in Figure 2. As stated in the article, the first six do not, visually, appear to vary over time, an impression confirmed by statistical testing. Footnote 106 is, unfortunately, erroneously attached to the article's figure 2 -- it should have accompanied Figure 1. But Table App.-6 demonstrates that the point holds that only in the last period did the mean change in a statistically significant way.
Figure App.-1 : Distribution by State of Within-State Court Order Population Coverage
(Expands article Figure 2)
Table App.-6: Accompanies Article Figure 2 (and Figure App. -1)
Statistical testing of state court-order coverage, over time
|
Mean court order coverage, within states, by facility |
Std. dev. |
F-test: Variance different from prior line?
P-value |
T-test:
Mean different from prior line? (2-tailed)
P-value |
Jails by facility |
|
|
|
|
| 1983 |
0.171 |
0.186 |
|
|
1988 |
0.164 |
0.191 |
0.850 |
0.647 |
1993 |
0.176 |
0.196 |
0.857 |
0.265 |
1999 |
0.164 |
0.162 |
0.198 |
0.399 |
Jails by population |
|
|
|
|
| 1983 |
0.333 |
0.270 |
|
|
1988 |
0.335 |
0.263 |
0.869 |
0.942 |
1993 |
0.334 |
0.269 |
0.890 |
0.947 |
1999 |
0.242 |
0.221 |
0.187 |
0.001* |
Prisons by facility |
|
|
|
|
| 1984 |
0.232 |
0.227 |
|
|
1990 |
0.258 |
0.265 |
0.275 |
0.422 |
1995 |
0.258 |
0.285 |
0.621 |
0.994 |
2000 |
0.194 |
0.296 |
0.774 |
0.224 |
Prisons by population |
|
|
|
|
| 1984 |
0.354 |
0.309 |
|
|
1990 |
0.378 |
0.322 |
0.780 |
0.574 |
1995 |
0.387 |
0.332 |
0.817 |
0.791 |
2000 |
0.254 |
0.347 |
0.762 |
0.036* |
* Difference is statistically significant.
3. The size effect and its changes over time
The article's Table 3 demonstrates that in each year of census data, court-order incidence is weighted towards larger facilities. Tables App.-7a and App.-7b set out the fancier statistical testing that confirms this point, for jails and prisons. I estimated logistic regressions of court-order incidence, separately for jails and prisons, as a function of year and size. More precisely, the regression produces odds ratios for year interacted with facility population divided by 200 – meaning, the increased likelihood of a court order if size increases by 200 people. I include squared and cubed terms as well, to allow several inflection points. Each of the coefficients, except for one the cubed term in 1999, is statistically significantly different from 0, and the size effect is positive in each year. (I also tested the same regression adding fourth-order covariates, but those additional coefficients were not significant so I omit them.)
Table App. -7a: Jails and the Size Effect:
Relationship between jail inmate population and court order incidence
| |
|
Model 1: Population/200 |
|
Model 2: Normed Population/ 200 |
|---|
| Census Year |
|
Odds ratio |
P>z |
95% Conf. Int. |
|
Odds ratio |
P>z |
95% Conf. Int. |
|---|
| 1983 |
adp |
3.8643 |
0.000 |
2.8972 |
5.1542 |
|
3.8640 |
0.000 |
2.8970 |
5.1538 |
|---|
| |
adp2 |
0.8269 |
0.000 |
0.7533 |
0.9078 |
|
0.8269 |
0.000 |
0.7533 |
0.9078 |
|---|
| |
adp3 |
1.0084 |
0.009 |
1.0021 |
1.0148 |
|
1.0084 |
0.009 |
1.0021 |
1.0148 |
|---|
| 1988 |
adp |
2.3609 |
0.000 |
1.9472 |
2.8625 |
|
3.5558 |
0.000 |
2.6754 |
4.7260 |
|---|
| |
adp2 |
0.9138 |
0.000 |
0.8770 |
0.9522 |
|
0.8216 |
0.000 |
0.7511 |
0.8987 |
|---|
| |
adp3 |
1.0030 |
0.002 |
1.0011 |
1.0048 |
|
1.0096 |
0.002 |
1.0035 |
1.0156 |
|---|
| 1993 |
adp |
1.6747 |
0.000 |
1.4977 |
1.8726 |
|
2.8758 |
0.000 |
2.2876 |
3.6154 |
|---|
| |
adp2 |
0.9753 |
0.000 |
0.9623 |
0.9884 |
|
0.9003 |
0.000 |
0.8510 |
0.9523 |
|---|
| |
adp3 |
1.0004 |
0.033 |
1.0000 |
1.0007 |
|
1.0032 |
0.033 |
1.0003 |
1.0061 |
|---|
| 1999 |
adp |
1.3032 |
0.000 |
1.1748 |
1.4458 |
|
2.0292 |
0.000 |
1.5378 |
2.6777 |
|---|
| |
adp2 |
0.9879 |
0.043 |
0.9764 |
0.9996 |
|
0.9169 |
0.043 |
0.8430 |
0.9973 |
|---|
| |
adp3 |
1.0002 |
0.159 |
0.9999 |
1.0005 |
|
1.0038 |
0.159 |
0.9985 |
1.0092 |
|---|
| |
|
Number of observations = 11474
LR chi2(12) = 588.07
Prob > chi2 = 0.0000
Log likelihood = -4514.1258
Pseudo R2 = 0.0612 |
|
Number of observations = 11474
LR chi2(12) = 588.06
Prob > chi2 = 0.0000
Log likelihood = -4514.1308
Pseudo R2 = 0.0612 |
|---|
Table App. -7b: Prisons and the Size Effect:
Relationship between prison inmate population and court order incidence
| |
|
Model 1: Population/200 |
|
Model 2: Normed Population/ 200 |
|---|
| Census Year |
|
Odds ratio |
P>|z| |
95% Conf. Int. |
|
Odds ratio |
P>|z| |
95% Conf. Int. |
|---|
| 1984 |
adp |
1.5967 |
0.000 |
1.3874 |
1.8371 |
|
1.5965 |
0.000 |
1.3874 |
1.8371 |
|---|
| |
adp2 |
0.9677 |
0.003 |
0.9469 |
0.9889 |
|
0.9677 |
0.003 |
0.9469 |
0.9889 |
|---|
| |
adp3 |
1.0007 |
0.068 |
1.0000 |
1.0014 |
|
1.0007 |
0.068 |
1.0000 |
1.0014 |
|---|
| 1990 |
adp |
1.4465 |
0.000 |
1.3061 |
1.6020 |
|
1.8248 |
0.000 |
1.5451 |
2.1551 |
|---|
| |
adp2 |
0.9725 |
0.000 |
0.9588 |
0.9864 |
|
0.9287 |
0.000 |
0.8944 |
0.9643 |
|---|
| |
adp3 |
1.0006 |
0.003 |
1.0002 |
1.0010 |
|
1.0026 |
0.003 |
1.0009 |
1.0044 |
|---|
| 1995 |
adp |
1.4939 |
0.000 |
1.3676 |
1.6319 |
|
2.5480 |
0.000 |
2.0740 |
3.1303 |
|---|
| |
adp2 |
0.9705 |
0.000 |
0.9592 |
0.9819 |
|
0.8498 |
0.000 |
0.7974 |
0.9056 |
|---|
| |
adp3 |
1.0007 |
0.000 |
1.0003 |
1.0010 |
|
1.0083 |
0.000 |
1.0040 |
1.0126 |
|---|
| 2000 |
adp |
1.1940 |
0.000 |
1.1038 |
1.2916 |
|
1.7016 |
0.000 |
1.3447 |
2.1533 |
|---|
| |
adp2 |
0.9986 |
0.768 |
0.9892 |
1.0080 |
|
0.9873 |
0.768 |
0.9071 |
1.0747 |
|---|
| |
adp3 |
1.0000 |
0.729 |
0.9998 |
1.0002 |
|
0.9988 |
0.729 |
0.9923 |
1.0054 |
|---|
Number of observations = 5047
LR chi2(12) = 335.60
Prob > chi2 = 0.0000
Log likelihood = -2685.8541
Pseudo R2 = 0.0588 |
|---|
The article's figure 3 illustrates the estimation for jails in 1993 and prisons in 1995. It is replicated below:
Article Figure 3 (reprinted): Estimated Probability of Court Order, Given Facility Size
Source: Derived from Bureau of Justices Statistics Prison and Jail Censuses,
supra note 81.
The figures following produce the corresponding illustration for all four census periods, for jails and prisons.
Figures App.-2a and 2b: Size Effect in Jails and Prisons
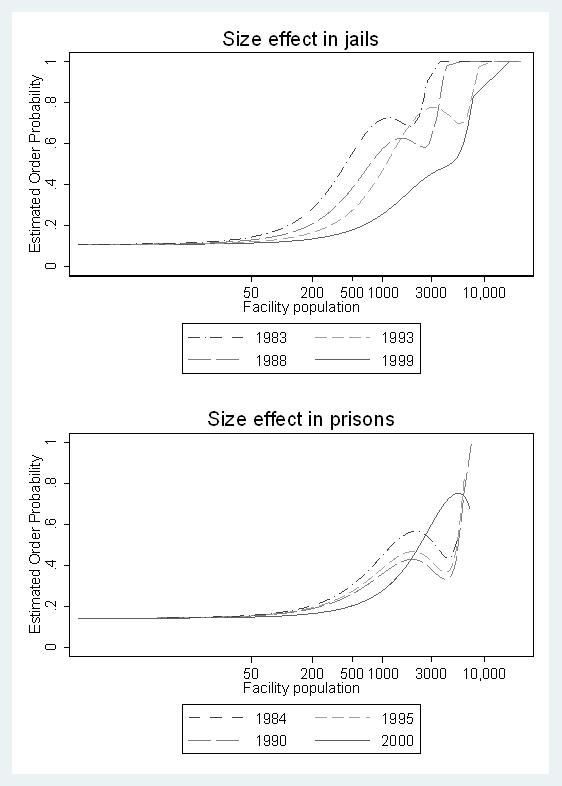
Like Tables App.-7a and -7b, the graphs show that the correlation of size and order-regulation is consistent and strong. Especially in prisons, the lines prior to the last period appear quite stable. Even so, statistical testing establishes that the most of the lines are statistically significantly different from the preceding lines. The only exception is the difference between the size effect in 1985 and in 1990, in prisons; they are statistically indistinguishable. But in the last period medium size prisons became quite a bit more likely to experience court orders, while small prisons became a little less so, and large prisons stayed about the same. This explains the article's Table 3’s demonstration that there were fewer prison facilities with court orders in 2000 than in 1995, but no decline in the population housed in court-order regulated prisons. For jails, however, Figure App.-7a shows that the size effect softened notably in both of the last two periods; in 1993, very large jails became less likely to report court orders, and by 1999 medium size jails joined them.
4. Court order topics
In the article, I refute a claim, made somewhat offhandedly in Charles F. Sabel & William H. Simon, Destabilization Rights: How Public Law Litigation Succeeds, 117 Harv. L. Rev. 1015, 1052 (2004), that medical care has grown to be a more common topic than overcrowding in prison-regulating orders. I state:
"The medical care point seems to be erroneous; at least in the census topic data, medical care has not outpaced overcrowding. In 2000, 14% of the total prison population was housed in facilities that reported a crowding order; 6% of the total prison population was housed in facilities that reported a medical care order. Even medical and mental health care together only barely outranked crowding as a court-order regulated topic. In jails, the Bureau of Justice Statistics did not ask about mental health orders, but 17% of the jail population was housed in facilities with medical care orders, compared to 28% in facilities with crowding orders. The results are similar when calculated by facility, rather than by population."
Table App.-8 sets out data on order topic from the most recent census administration, in jails and prisons, by facility and weighted by population, with the lines relevant to this analysis in bold.
Table App.-8: Reporting rates for court orders, by topics
| |
1999: Jail |
2000: Prison |
| |
% of facilities |
% of incarcerated population |
|
% of facilities |
% of incarcerated population |
| ANY ORDER |
14.8% |
33.9% |
|
22.7% |
39.4% |
| Any population order |
12.5% |
28.7% |
|
9.9% |
13.7% |
| population cap |
11.7% |
26.2% |
|
9.2% |
12.9% |
| non-population cap crowding order |
6.3% |
25.3% |
|
6.5% |
11.3% |
| Totality of conditions |
|
|
|
3.6% |
7.1% |
| Medical or mental health care |
3.7% |
17.5% |
|
6.7% |
15.3% |
| Medical care |
3.7% |
17.5% |
|
3.4% |
5.8% |
| Mental health care |
|
|
|
5.7% |
13.9% |
| Administrative segregation |
2.2% |
11.3% |
|
2.4% |
3.0% |
| Discipline |
2.6% |
12.3% |
|
2.8% |
4.4% |
| Grievance policies |
2.9% |
10.6% |
|
1.8% |
1.5% |
| Staffing |
3.6% |
15.2% |
|
2.6% |
3.6% |
| Food/sanitation |
3.4% |
13.1% |
|
1.7% |
1.4% |
| Visiting/mail/phone |
3.2% |
14.1% |
|
6.6% |
7.8% |
| Recreation/exercise |
4.0% |
16.3% |
|
2.3% |
2.5% |
| Fire safety |
2.6% |
9.9% |
|
1.5% |
1.4% |
| Counseling |
1.5% |
7.4% |
|
1.3% |
1.0% |
| Inmate classification |
2.9% |
14.6% |
|
2.0% |
1.8% |
| Library services |
2.9% |
13.9% |
|
2.3% |
2.9% |
| Religious practices |
2.1% |
11.1% |
|
5.8% |
8.2% |
| Education/training |
1.9% |
8.2% |
|
2.0% |
1.8% |
| Accommodation of disability |
|
|
|
6.0% |
13.6% |
| Search policies |
2.1% |
8.9% |
|
1.0% |
0.5% |
| Other |
1.5% |
7.2% |
|
12.1% |
21.5% |
Full data, for all census administrations, is available here (in excel format) and here (in pdf format)
5. Ideological trends in reported U.S. District Court decisions.
In the article, I report that "Studies of district court voting behavior confirm the predicted rightward shift in reported opinions." and cite Kenneth L. Manning & Robert A. Carp, Declarations of Independence? Federal District Court Judges and the Congruence of their Decision-Making with Public Opinion, 15 tbl.2 (unpublished manuscript, prepared for 2003 Southwestern Pol. Sci. Ass’n). The relevant table is reprinted below, with permission, as Table App.-9 (for downloading, it is also in pdf and in excel). Manning and Carp's scores are "liberal percentages" -- that is, the percentage of reported opinions by district court judges that favor, for example, the defendant in criminal cases. So a decline over time means a rightward shift.
Table App.-9: District Court Judges' Ideology Scores,
By Topic, Over Time
(courtesy of Kenneth L. Manning & Robert A. Carp)
| Year |
Criminal Justice |
Civil Liberties & Rights |
Economic & Labor Regulation |
COMPOSITE IDEOLOGY SCORE |
|---|
1956 |
16.46 |
45.00 |
59.63 |
40.36 |
|---|
1957 |
23.84 |
40.91 |
64.07 |
42.94 |
|---|
1958 |
17.07 |
25.00 |
59.22 |
33.76 |
|---|
1959 |
18.29 |
41.98 |
53.69 |
37.99 |
|---|
1960 |
21.91 |
37.35 |
66.52 |
41.93 |
|---|
1961 |
23.62 |
41.77 |
65.59 |
43.66 |
|---|
1962 |
23.91 |
40.91 |
64.02 |
42.95 |
|---|
1963 |
23.39 |
46.22 |
60.71 |
43.44 |
|---|
1964 |
23.46 |
29.2 |
63.71 |
38.79 |
|---|
1965 |
22.47 |
37.39 |
58.82 |
39.56 |
|---|
1966 |
23.10 |
50.00 |
63.21 |
45.44 |
|---|
1967 |
21.47 |
36.36 |
64.86 |
40.90 |
|---|
1968 |
23.50 |
40.7 |
62.06 |
42.09 |
|---|
1969 |
27.85 |
56.90 |
62.31 |
49.02 |
|---|
1970 |
22.94 |
55.12 |
68.31 |
48.79 |
|---|
1971 |
28.67 |
51.15 |
63.71 |
47.84 |
|---|
1972 |
31.84 |
57.50 |
56.75 |
48.70 |
|---|
1973 |
28.95 |
49.85 |
58.40 |
45.73 |
|---|
1974 |
30.11 |
42.03 |
58.81 |
43.65 |
|---|
1975 |
29.91 |
43.02 |
55.75 |
42.89 |
|---|
1976 |
29.06 |
44.93 |
57.21 |
43.73 |
|---|
1977 |
31.75 |
48.28 |
51.51 |
43.85 |
|---|
1978 |
33.64 |
47.71 |
54.10 |
45.15 |
|---|
1979 |
33.64 |
51.30 |
58.09 |
47.68 |
|---|
1980 |
39.79 |
52.20 |
56.90 |
49.63 |
|---|
1981 |
36.75 |
50.67 |
58.46 |
48.63 |
|---|
1982 |
28.07 |
45.49 |
60.16 |
44.57 |
|---|
1983 |
28.24 |
44.53 |
54.84 |
42.54 |
|---|
1984 |
30.04 |
44.72 |
53.81 |
42.86 |
|---|
1985 |
33.71 |
43.02 |
54.28 |
43.67 |
|---|
1986 |
30.28 |
41.93 |
51.60 |
41.27 |
|---|
1987 |
31.68 |
42.05 |
53.91 |
42.55 |
|---|
1988 |
30.67 |
44.28 |
53.48 |
42.81 |
|---|
1989 |
32.55 |
39.66 |
53.40 |
41.87 |
|---|
1990 |
26.23 |
40.20 |
53.04 |
39.82 |
|---|
1991 |
28.61 |
38.97 |
53.79 |
40.46 |
|---|
1992 |
32.58 |
35.40 |
56.40 |
41.46 |
|---|
1993 |
35.66 |
38.74 |
53.88 |
42.76 |
|---|
1994 |
32.80 |
38.12 |
52.33 |
41.08 |
|---|
1995 |
24.58 |
35.00 |
52.86 |
37.48 |
|---|
1996 |
29.35 |
34.40 |
51.24 |
38.33 |
|---|
1997 |
30.92 |
35.07 |
54.24 |
40.08 |
|---|
1998 |
27.22 |
37.84 |
56.03 |
40.36 |
|---|
Source: Kenneth L. Manning & Robert A. Carp,
Declarations of Independence? Federal District
Court Judges and the Congruence of their Decision-Making
with Public Opinion, p. 15 (replicated with permission) |
|---|
6. Cases citing Lewis v. Casey for propositions relating to limiting injunctive relief.
Of 740 court of appeals cases that came up during Summer 2005 on a search “Lewis v. Casey” in Westlaw’s cta database, the following twelve cases appear to be the only ones in which Lewis is cited in support of general skepticism of broad injunctive relief.
Case name, citation |
Quotation or description |
Reynolds v. Wagner, 128 F.3d 166 (3d Cir. 1997) |
Declining to resolve purported conflict between Lewis and Helling v. McKinley, because plaintiffs case failed on other grounds. |
Armstrong v. Davis, 275 F.3d 849, 870 (9th Cir. 2001) |
" 'The scope of injunctive relief is dictated by the extent of the violation established.' Lewis, 518 U.S. at 359, 116 S.Ct. 2174. The key question, for purposes of Lewis, is whether the inadequacy complained of is in fact 'widespread enough to justify system wide relief.' Lewis, 518 U.S. at 359, 116 S.Ct. 2174." |
Guajardo v. Texas Dept. of Criminal Justice, 363 F.3d 392 (5th Cir. 2004) |
“As the district court noted, the Supreme Court has required system-wide injury for system-wide injunctive relief. . . . [S]ee Lewis v. Casey.” |
Benjamin v. Fraser, 343 F.3d 35, 51 (2nd Cir. 2003) |
Citing Lewis for the proposition that to establish the deprivation of a basic human need such as reasonable safety, an inmate must show "actual or imminent harm." |
Ziegler v. Michigan, 59 Fed.Appx. 622, (6th Cir. 2003) |
Citing Lewis in support of holding that “[t]he district court did not abuse its discretion in declining to certify a class, as Ziegler failed to show that he was personally injured by the complained-of conditions, rather than other unidentified members of a class he purported to represent.” |
Gomez v. Vernon, 255 F.3d 1118, (9th Cir. 2001) |
Citing Lewis and upholding injunction in favor of individual inmates where district court denied class-wide relief, after explaining that, “Having concluded that the circumstances justify injunctive relief, we must next determine whether the relief granted was properly tailored.” |
Higgason v. Cohn, 175 F.3d 1020 (7th Cir. 1999) |
“Unless at least one named plaintiff can demonstrate an actual or imminent injury in fact stemming from the deliberate indifference of prison officials, we have no basis on which to consider either system wide problems or on which to grant system wide relief. See Lewis v. Casey, 518 U.S. 343." |
Dulany v. Carnahan, 132 F.3d 1234, 1244 (8th Cir. 1997) |
"Unless at least one named plaintiff can demonstrate an actual or imminent injury in fact stemming from the deliberate indifference of prison officials, we have no basis on which to consider either system wide problems or on which to grant system wide relief. See Lewis v. Casey, 518 U.S. 343, ----, 116 S.Ct. 2174, 2179 (1996) ("the success of the respondents' systemic challenge [is] dependent on their ability to show widespread actual injury").” |
Clarke v. Stalder, 121 F.3d 222 (5th Cir. 1997), vacated on other grounds, 154 F.3d 186 (5th Cir. 1998) (en banc) |
“The question of a litigant's standing to bring suit is jurisdictional as it implicates judicial power under Article III. Accordingly, we must examine it sua sponte if necessary. E.g., Lewis v. Casey, 518 U.S. 343, ---- n. 1, 116 S.Ct. 2174, 2178 n. 1, 135 L.Ed.2d 606 (1996).” |
Johnson v. Rodriguez, 110 F.3d 299, 304 n.8 (5th Cir. 1997) |
Noting in dicta that “as a general rule class injuries attributable to members of a class but not sustained by a named class representative cannot be remedied in the class action lawsuit.”) |
Smith v. Arkansas Dept. of Correction, 103 F.3d 637 (8th Cir. 1996) |
Discussing standing and the scope of litigated relief in light of Lewis. |
Women Prisoners of District of Columbia Dept. of Corrections v. District of Columbia, 93 F.3d 910 (D.C. Cir. 1996) |
“These may all be highly desirable measures, but the Supreme Court has repeatedly warned against such detailed marching orders. See, e.g., Lewis, 518 U.S. at ----, 116 S.Ct. at 2186.” |